Nested Traking Graphs - Minimal Example
- Based on the paper Nested Tracking Graphs [Lukasczyk et al.]
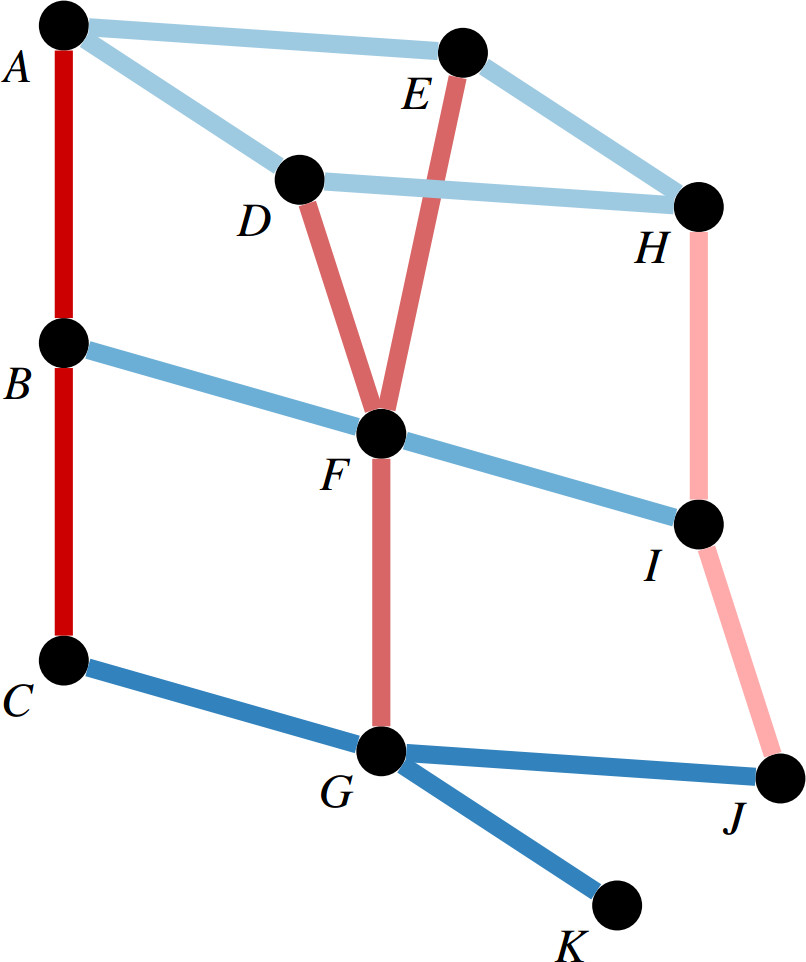
- Minimal Example that shows how to draw a Nested Tracking Graph G = (N, ET, EN) where
- N is a set of nodes;
- ET is a list of edge sets that represent the tracking graphs, and;
- EN is a list of edge sets that represent the nesting trees.
- Each node has a label, a time (t), a level (l), and optional a width (w)
- For each level there exists an edge set in ET that connect nodes of adjacent timesteps
- For each time there exists an edge set in EN that connect nodes of adjacent levels
- Here is the graph G for the simple example below where edges in ET are shown in shades of blue, and edges in EN are shown in shades of red:
Downloads
Library DependenciesInteractive Demo
Example: